Everyone knows that likes, shares and follows are vanity metrics – great for making you feel good on a rainy Thursday afternoon, but not so helpful when it comes to measuring the success of social media campaigns designed to promote business services or considered purchases.

So how are you meant to tell whether your latest spate of facebook posts actually moved the dial? Or report on the ROI of your latest LinkedIn campaign in a way that’ll get the rest of the c-suite to sit up and listen?
As you’ve probably guessed, there’s no ‘right’ answer to this indisputably-thorny question. Groups like Sprout Social say that metrics like share of voice (SOV) and reach are the gold standard for measuring the impact of your social media campaigns, while the folks over at CGM group say that you can only measure ROI accurately when you’re tracking conversions, average order values (AOV) and the average lifetime order value of a customer obtained via your social channels.
Us? Well, we’re somewhere in the middle. We don't buy into the idea that conversions and/or revenue are the only way of measuring a campaigns success, but we’re not sold on the validity of metrics like share of voice either.
Knowing the exact percentage of potential scrollers who saw your video series sounds useful, but it doesn’t tell you anything about how your message was received; how people felt about your offering or how many scrollers you managed to turn into paying customers.
In all honesty, we think the ‘right’ metrics probably depend on what you’re trying to achieve with your social media campaigns but that feels like a bit of a cop out, so we’ve decided to ditch the preachy essay about goal-setting and give you some simple - actionable - tips that are geared towards helping you accurately map the success of your social media campaigns.
We’ll tell you where to look for interesting data, how to interpret it and when to use it in your reporting. We’ll also talk you through some of the common mistakes people make when
Moving Beyond Simple Vanity Metrics
Having established that we don’t care about likes, impressions or shares, let’s talk about visits to your website (otherwise known as social media traffic).
When you get down to it, most social media campaigns are designed to inform people about a product or service that you’re offering. Raising brand awareness or building your profile is all good and well but ultimately, when we get down to brass tacks, you’re engaging people because you want them to buy something from you, or enquire about your services.
And that means you’re probably going to link back to your website at some point – so that people can read more about whatever you’re offering and/or start engaging with your brand in more meaningful ways.
Given that you’re actively looking to drive people towards your website, looking for trends in your social media traffic is a great way to start gauging the merits of your campaign. CLICK TO TWEET
Lots of new visitors means that you’re probably doing a good job of generating interest (or demand, if you want to lean on trending buzzwords) while a relatively lacklustre showing probably means that you’ve missed the mark somewhere.
To check on your social media traffic, head over to Google Analytics, login and navigate to "Acquisition" on the left hand side. From here, you want to hit "Overview", which will load in a screen that shows all of your inbound web traffic arranged by source.

You can modify your date ranges using the toggles in the upper right hand side of the screen, and if you scroll down and click on “Social”, you’ll see a graph that shows your overall social traffic growth over time:
Seeing graphs that move up and to the right? Fantastic. You can skip the next section of this guide because you're clearly reaching people that are interested in your offering, and your ads are obviously convincing enough to get busy people clicking through to your site.
But that doesn’t mean you can break out the champagne.Healthy traffic’s a pretty good sign that you’ve nailed the fundamentals, but if you want to know whether your campaign’s actually moving the dial, you’ll want to spend a bit of time evaluating::
- The way social media visitors behave once they reach your site
- The number of recorded conversions linked to social media visitors
- The revenue associated with your social media traffic.
We’ll cover all three of these areas in more detail below. But first, let’s take a look at how to diagnose problems with your social media traffic
Troubleshooting Low Traffic
If you’re posting regularly and/or paying for social media traffic via paid ads, you should see a steady increase in your social media traffic. If this isn’t the case, you might be:
- Putting your ads or posts in front of the wrong people
- Serving ads that aren’t convincing
- Serving ads that are actively dissuading people from clicking through to your site
- Tracking social media traffic incorrectly (yes, it happens!)
Now, these are three completely-different and equally-complex problems that probably deserve their own dedicated blog posts but for now we’ll just say that it’s worth spending some time reviewing your audience demographics, your creative and your tracking setup.
Look for any evidence that your ads or posts are popping up in front of the wrong crowd, or examples of bad creative that could be sabotaging your best efforts.
You should also spend a bit of time making sure that your Analytics or Tag Manager tracking set up has been implemented properly. It’s surprisingly easy to overlook minor problems with misfiring code or broken containers but if you can’t track accurately, you’ll never see the stats you’re expecting.

Measuring On-Site Behaviour
Assuming that you are getting plenty of social media traffic, your next step should be establishing what they’re doing when they reach your website.
Eg. do they spend time reading a few pages of content, or do they bounce straight off your site and continue browsing Facebook? What percentage of them reach out for more information and how frequently do they go back and forth between the different parts of your website.
Now, it’s worth pointing out that every audience is different: People selling legal services to a niche industry like bathroom fitters will probably see much better engagement metrics than someone who’s selling a generic product to members of the general public but there are still some things you’d want to see on every website, namely:
- Good time on page rates
- Low bounce rates
- High page per session rates
The idea being that these stats show you people moving around your website; engaging with your content and showing a demonstrable interest in what you’re offering.
There are several ways to check on-site engagement stats in Analytics but we’ll talk you through the simplest one here: Login, and then click the “Acquisition” drop-down on the left.
Select “Overview” And a screen like this will load:

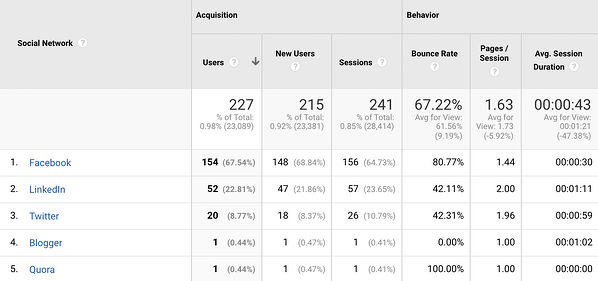
Now it’s just a case of hitting the social option, which will load in a per-channel breakdown of your social stats.

What Do Good Engagement Stats Look Like?
As with all things digital marketing, there’s no definitive measure of ‘good’ engagement rates but we think it’s beyond irritating when people are vague so we’ve done our best to source some industry averages to give you a steer.
Take these with a massive pinch of salt because they can vary depending on the amount of content on your site; your site design, your audience, the day of the week and the colour of your socks but you generally want to see average time on page rates of around 2-3 minutes, as this is just about the right amount of time for people to skim-read a 500-1000 word page of content. (Source: Databox).
You should also look for Bounce Rates that are at or below 55% (Source: SEMRush) and at least 1.5 pages per session on average. (Source: Littledata)
But again, it’s worth evaluating your site structure and campaign format because pointing social media visitors at a landing page with limited navigation options will naturally depress key engagement statistics like average pages per session.

What About Conversions?
Engagement is all good and well, but the easiest - and most straightforward - way to measure the ROI of any campaign is to look at your conversions. This is, for skeptical members of the C-suite, cut and dry evidence that your campaigns are working but it is worth noting that you can’t really measure conversion data in isolation.
People will tell you that they only care about cold, hard cash but unless your site has a very simple purchase journey and/or you’re selling something extremely desirable at a very low price, you won’t be able to see the bigger picture by looking at conversions on their own.
Marrying info about money earned with data about people’s on-site behaviour will give you a more holistic view of your campaign’s merits and allow you to start troubleshooting any problems killing your conversion rates.
Mini-disclaimer out of the way, let’s look at how to track conversion data for your social media traffic.
Assuming that you’ve got conversion tracking set up correctly (and that you’re tracking worthwhile conversions like sales or enquiries) you can just head over to Google Analytics, select “Conversions > Goals > Overview” and you should be confronted with a screen that looks a bit like this:
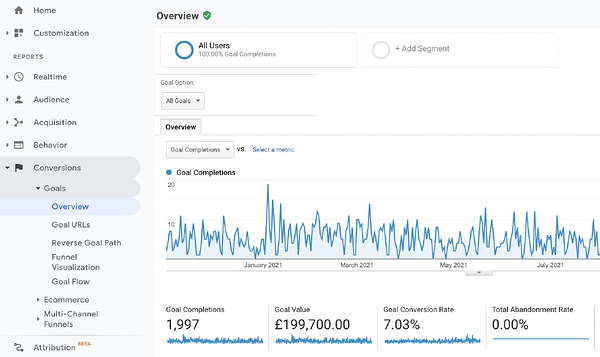
From here, you’ll want to segment your view so that you can only see conversions from social traffic (you’re currently looking at conversion data from every user, irrespective of referring medium).
To do this, go up to segments and click “add new segment”. You should see the following dialogue box open up in front of you.
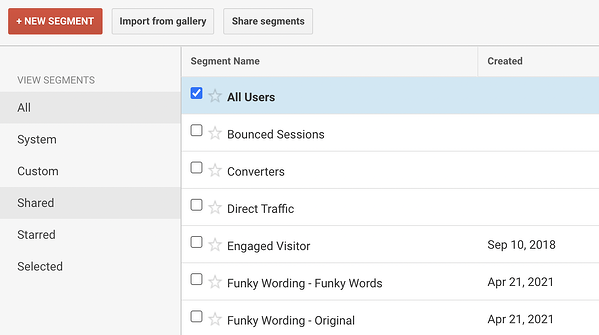
From here, you want to click “new segment” (the big button to the top left of the box) and then go down to traffic sources. In the medium box, type social, which tells Google to create a segment (like a filter) that’s designed to look at people coming from mediums tagged as social media sources.
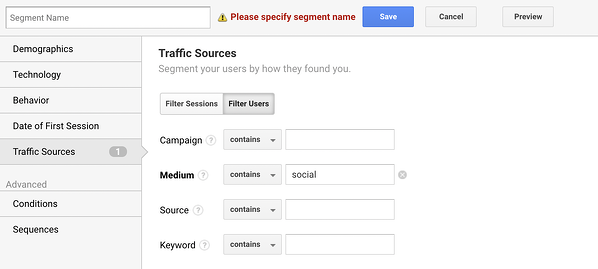
Give your new segment a name (oops) and click save. Viola! You should be looking at a graph showing conversions from social media traffic.
Having Trouble Tracking Conversions Or Understanding Your Social Metrics?
We get it, a lot of this stuff is fairly technical and you have a lot to do. Thing is, setting up proper conversions and tracking the success of your social media campaigns is key to demonstrating their value.
If you’re pressed for time and you can’t stomach unpicking this stuff yourself, our marketing team would be more than happy to help you out. We’re a friendly bunch and we’ve got bags of hands-on experience when it comes to Analytics, goal tracking and reporting. Just drop us a line and one of the team will be in touch.